
When running performance tests with Apache JMeter, one of the most common goals is to generate traffic at a controlled rate, often measured in Transactions Per Second (TPS) or Requests Per Second (RPS). For example, if your SLA requires your system to handle 10 TPS, you need to configure JMeter so that it consistently sends exactly 10 transactions every second.
But achieving precise TPS is not always straightforward. JMeter, by default, is designed to simulate virtual users (threads) executing requests as fast as possible, which may not align with your target throughput. Without proper configuration, your test might either overshoot the TPS (causing a higher load than required) or fall short (not testing the system at the desired capacity).
In this article, we’ll look at different ways to achieve an exact TPS and figure out which method works best.
Note: We have also attached a video at the end of this article. In case you are more comfortable with the video version, please feel free to have a look
There are mainly two commonly used approaches:
- Constant Throughput timer
- Precise Throughput timer
So, let’s see which one should we use and why?
In our example, we will use “https://jsonplaceholder.typicode.com/posts/1” API to showcase the use of both the timers and try to hit an exact 1 TPS.
Table of contents –
- Executing the API
- Constant throughput timer
- Precise throughput timer
- Which to use: Precise throughput timer vs Constant throughput timer
Executing the API
Set Up a Test Plan
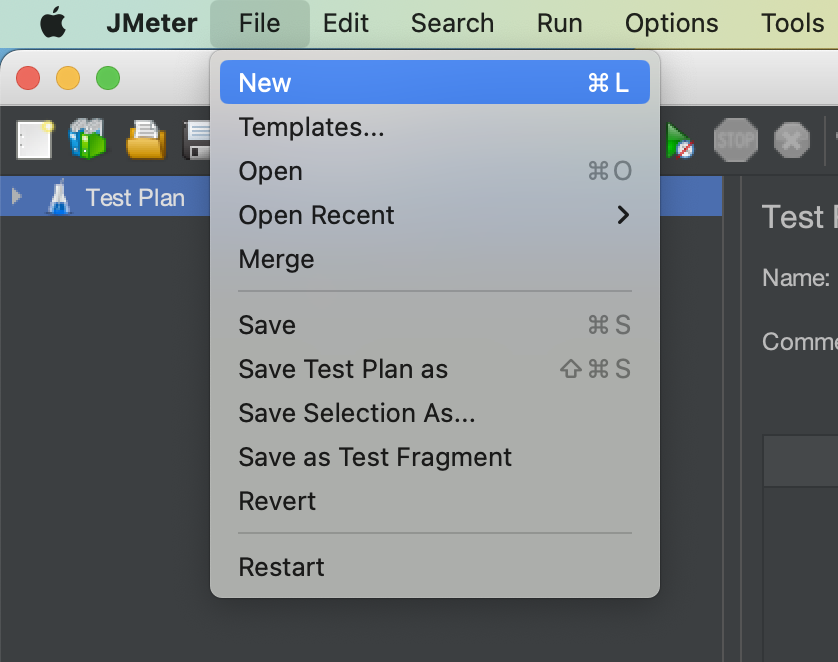
- Launch JMeter.
- Go to the “File” Menu and select “New”.
- This will create a new test plan to be used in our example.
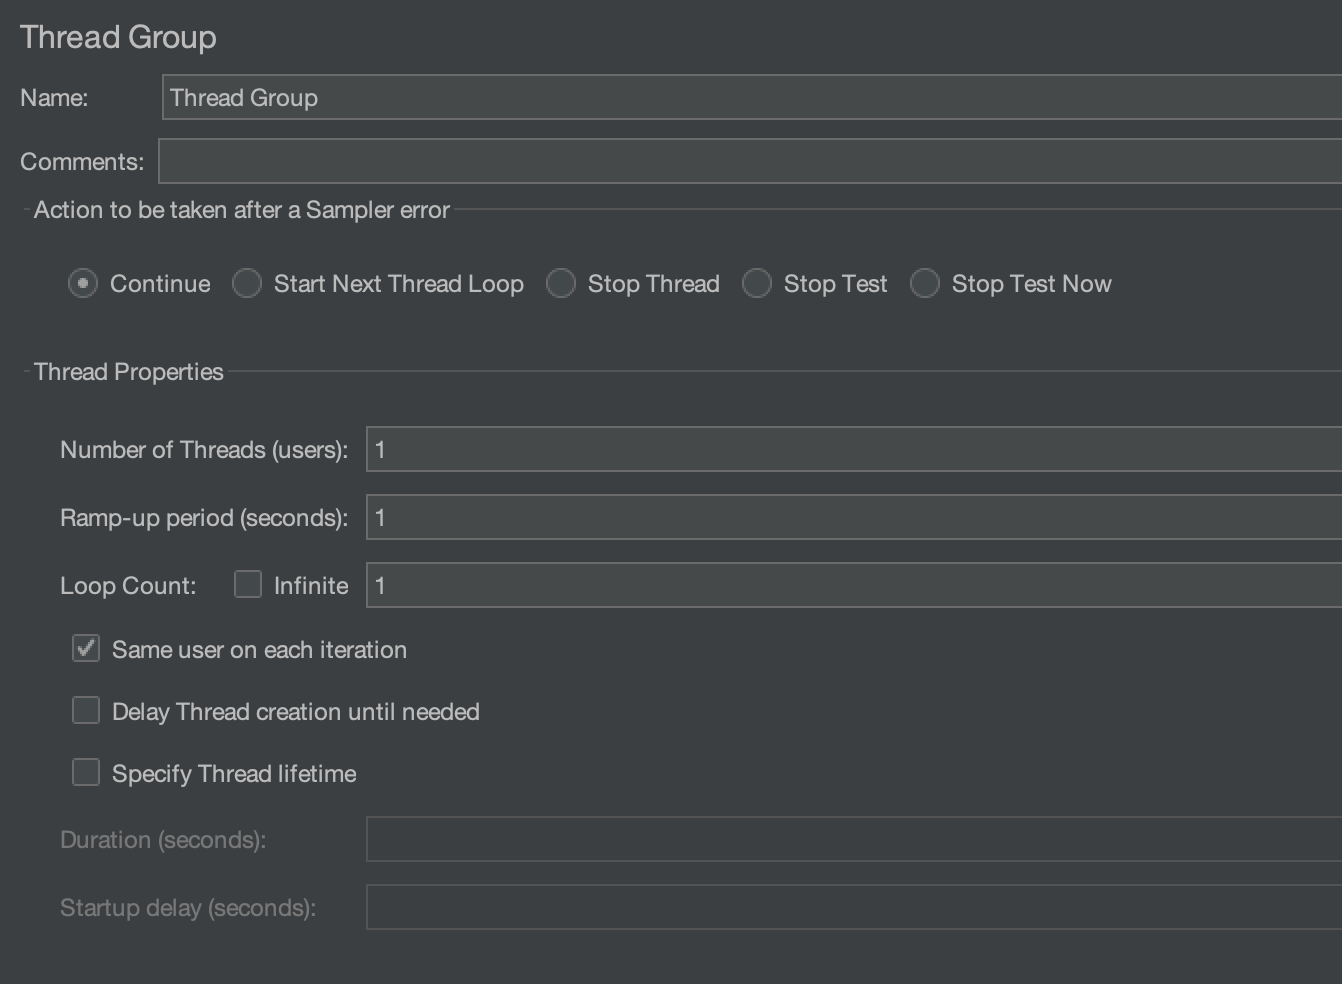
Create a Thread Group
- Right-click on the Test Plan.
- To create a Thread group, simply go to “Add > Threads (Users) > Thread Groups”.

The Thread Group is used to execute a specific number of tests. For simplicity, we will keep it set at 1. Please refer to the image below for configurations.
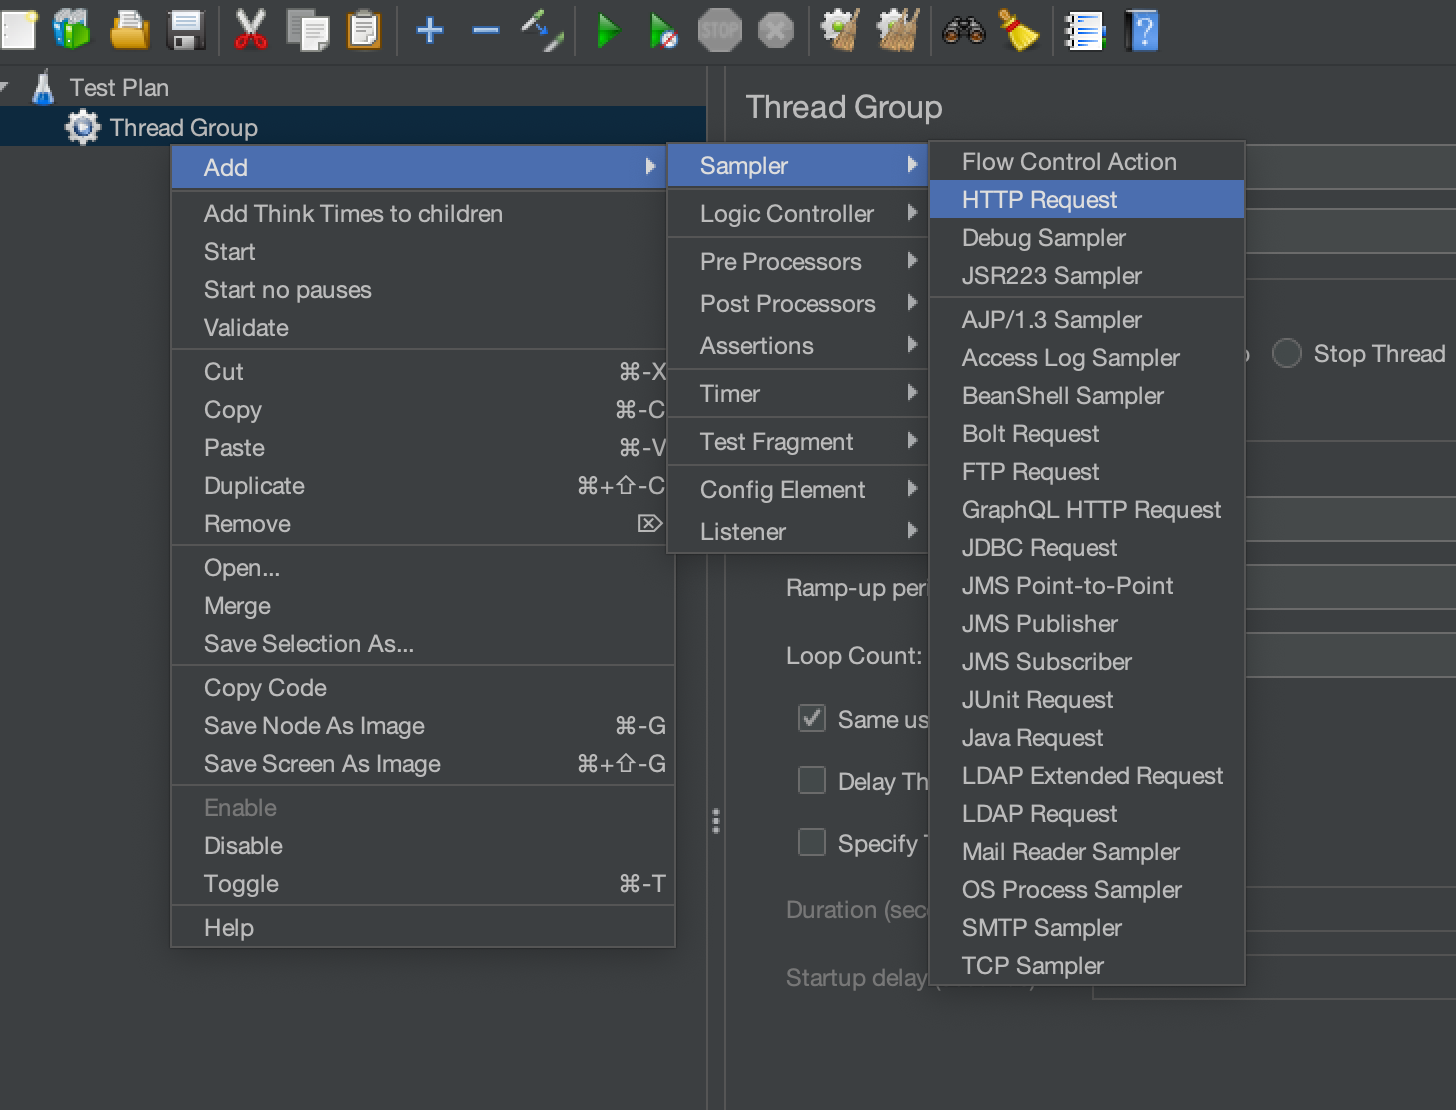
Add an HTTP sampler
We will use an HTTP sampler to execute a dummy API (https://jsonplaceholder.typicode.com/posts/1). Create an HTTP sampler by right-clicking on the Thread Group and selecting “Add” > “Sampler” > “HTTP Request”.
We will hit the GET request on the “https://jsonplaceholder.typicode.com/posts/1” API. So, we will add it to the HTTP sampler by following the below steps.
- Please enter “https” in the input box that is labelled “Protocol[https]:“.
- Enter “jsonplaceholder.typicode.com” in the input box labelled “Server Name or IP”.
- By default, the HTTP request value is set to GET. Since we are only executing a GET request, we won’t be changing it.
- Set the Path to “/posts/1“.

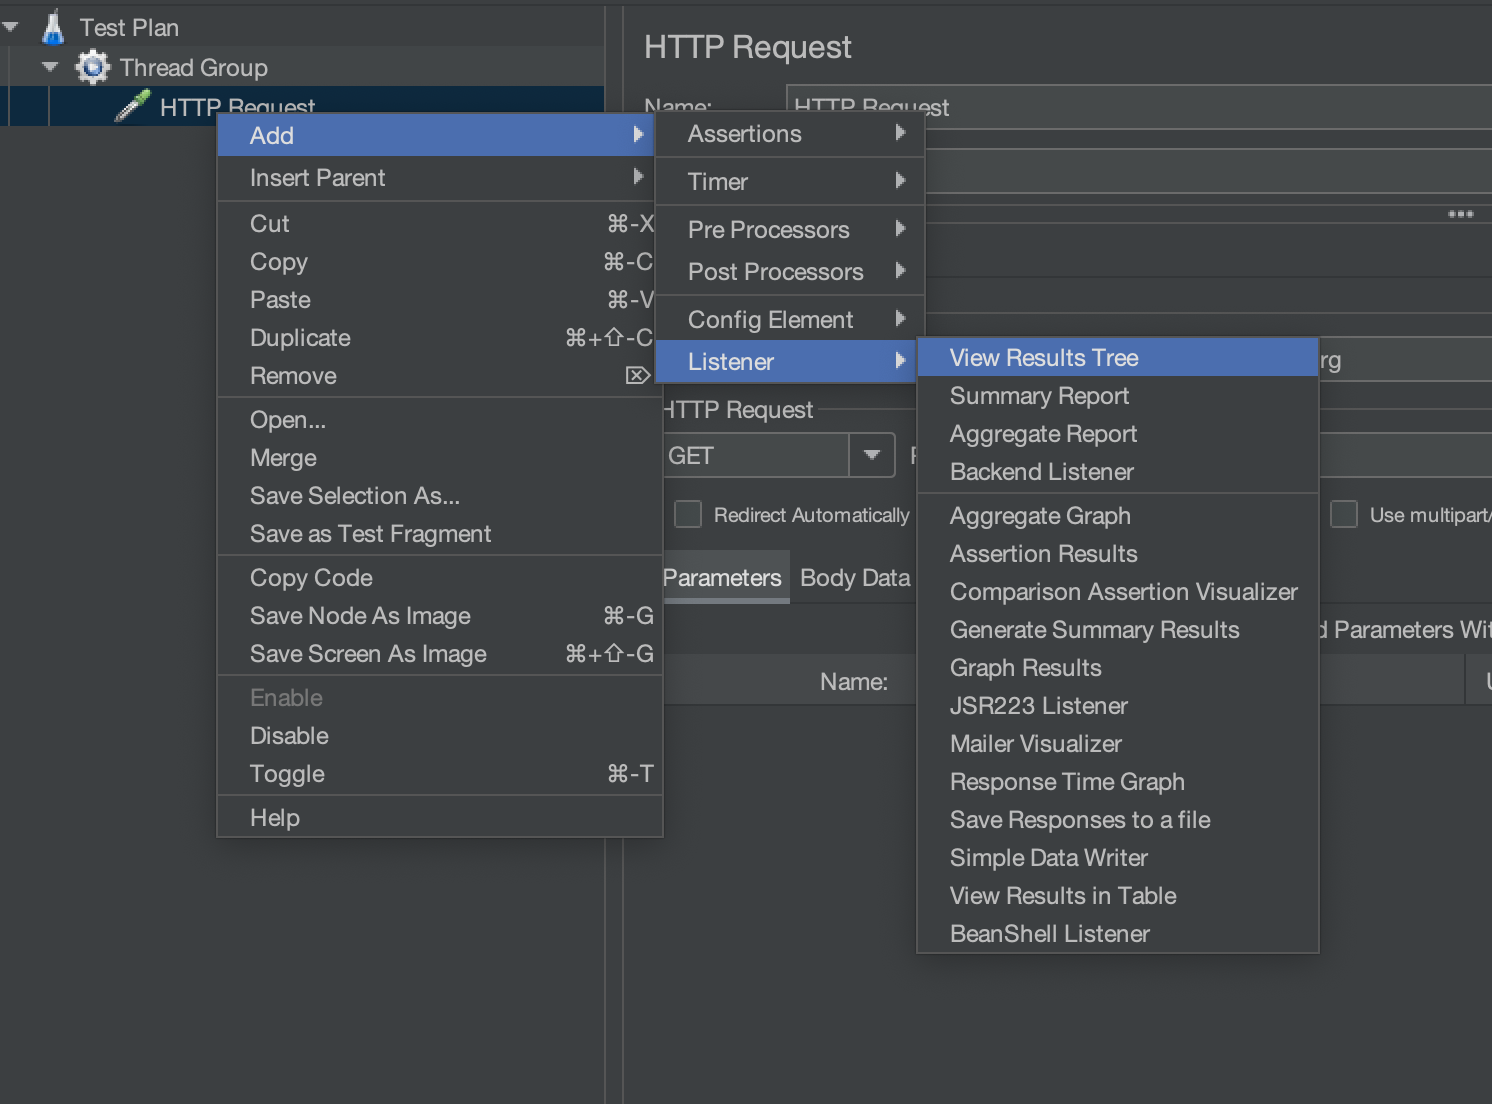
Add “View Results Tree” listener
View Results Tree listener is one of the most used listeners in Jmeter. It provides detailed information about server responses during performance testing.
Add the “View Results Tree” listener by right-clicking on the HTTP request and selecting “Add” > “Listener” > “View Result Tree”.
Run Test and monitor results
Run the test case by clicking on the green start button and analyze the results in the “view result tree” listener.
Constant throughput timer
Now, let’s add the Constant Throughput Timer to our Test Plan. To do this, just right-click on the Thread Group, then go to “Add” > “Timer” > “Constant Throughput Timer”.

On the Constant Throughput Timer screen, you’ll notice a few options. Since we want the TPS to be 1, we’ll configure the values as follows:
- Target Throughput → 60
The “Target Throughput” field defines how many requests should be sent per minute. Since 1 TPS means 1 request per second (which equals 60 requests per minute), we’ll set this value to 60.
- Calculate Throughput Based On → Select “All active threads” from the dropdown
For this simple example, the choice won’t make a difference. But in a real-world scenario, you might be running multiple APIs within a single Test Plan. Selecting “All active threads” ensures that the combined throughput across all requests is maintained at 60 requests per minute (1 TPS).

Thread Group Configuration
Next, set the “Number of Threads” to 15 and the “Thread Lifetime” to 120 seconds. We’ll understand shortly why we chose 15 threads.

Add Aggregate Report Listener

We are adding aggregate report to see actual throughput and number of requests sent over time.
Let’s Start the execution
Let’s go ahead and start the execution. We’ll add screenshots of both the start and the end of the run, as this will help us highlight an important detail about the Constant Throughput Timer.
Start of the execution –

End of the execution –

There are a few important observations to note here:
- Burst at the start: At the beginning of the execution, there was a sudden spike in requests. The TPS shot up to around 9.4 requests/second, even though our target was just 1 request/second.
- Extra requests: Since we wanted 1 TPS, over 120 seconds there should have been exactly 120 requests. But as the screenshot shows, a total of 134 requests were sent.
- Not all bad: On the positive side, the overall TPS across the 120-second interval came out to about 1.1 TPS, which is fairly close to our target of 1 TPS.
In short, the Constant Throughput Timer can give you an approximate result. However, because it often overshoots at the start (depending on the number of threads), it can cause a burst of requests initially, leading to higher response times at the beginning of execution.
The Precise Throughput Timer addresses many of the limitations of the Constant Throughput Timer. Let’s take a closer look at how it works.
Precise throughput timer
Now, let’s add the Precise throughput timer and remove the Constant Throughput Timer.

Since we want 1 TPS (or 60 requests per minute), we’ll enter the following values on the Precise Throughput Timer screen.

Let’s Start the execution
Again, we’ll include screenshots showing both the start and the end of the execution.
Start of the execution –

End of the execution –

- At the start of the execution, the TPS was around 2.2 requests/second, which is much closer to our target compared to the 9.4 requests/second we saw with the Constant Throughput Timer.
- Additionally, the Precise Throughput Timer sent exactly 120 requests (1 request per second), while the Constant Throughput Timer sent 134 requests.
Clearly, the Precise Throughput Timer is the better choice. So, let’s conclude the article with the next point.
Which to use: Precise throughput timer vs Constant throughput timer
We’ve already seen that the Precise Throughput Timer (PTT) is better for generating a specific TPS, but let’s summarize the key points for easier understanding:
Suitability for SLAs
- SLAs often specify exact TPS requirements (e.g., “System must sustain 50 TPS continuously”).
- CTT: Might meet the average, but second-to-second fluctuations could violate SLA.
- PTT: Ensures SLA compliance by keeping TPS stable every second.
Short Test Accuracy
- CTT: Works poorly for short or burst tests because it needs time to “average out.”
- PTT: Accurate from the very first second, making it perfect for spike or stress testing.
So, we should use “Precise Throughput Timer” to generate a specific TPS.
Video Tutorial
We hope that you have liked the article. If you have any doubts or concerns, please write to us in the comments or mail us at admin@codekru.com.