
In performance testing with Apache JMeter, maintaining a consistent request rate is often crucial to simulate real-world user behavior and to identify how an application performs under a specific load. The Constant Throughput Timer (CTT) is a built‑in JMeter element designed precisely for this purpose. In this article, we will cover the Constant Throughput Timer (CTT) of JMeter in detail with examples.
What we will learn:
- What Is the Constant Throughput Timer in JMeter?
- Why Use a Constant Throughput Timer?
- How to add Constant Throughput Timer in a Test Plan?
- How to use Constant Throughput Timer with Examples
What Is the Constant Throughput Timer in JMeter?
The Constant Throughput Timer (CTT) is a JMeter Timer element that regulates the pace at which requests (samples) are sent, enforcing a fixed throughput, measured in samples per minute ( e.g. 30 requests/minute ), regardless of how fast your threads can execute. Unlike simple delay timers that pause each thread for a fixed or random duration, CTT dynamically calculates and applies delays to maintain the overall target request rate across the test.
Why Use a Constant Throughput Timer?
- Controlled Load Pattern
Without a throughput timer, JMeter threads fire as fast as possible. This can overload the target server or produce unrealistic spikes. Constant Throughput Timer (CTT) ensures a steady, predictable request rate (throughput) over time. - Realistic Simulation
Many applications experience a constant or near‑constant number of transactions per second (TPS) in real environments (e.g., API endpoints serving a fixed number of users per minute). The CTT allows you to replicate such scenarios. - Comparative Analysis
By fixing throughput, you can compare application behavior (response time, error rate) under the same load across different builds, configurations, or environments.
How to add Constant Throughput Timer in a Test Plan?
Set Up a Test Plan
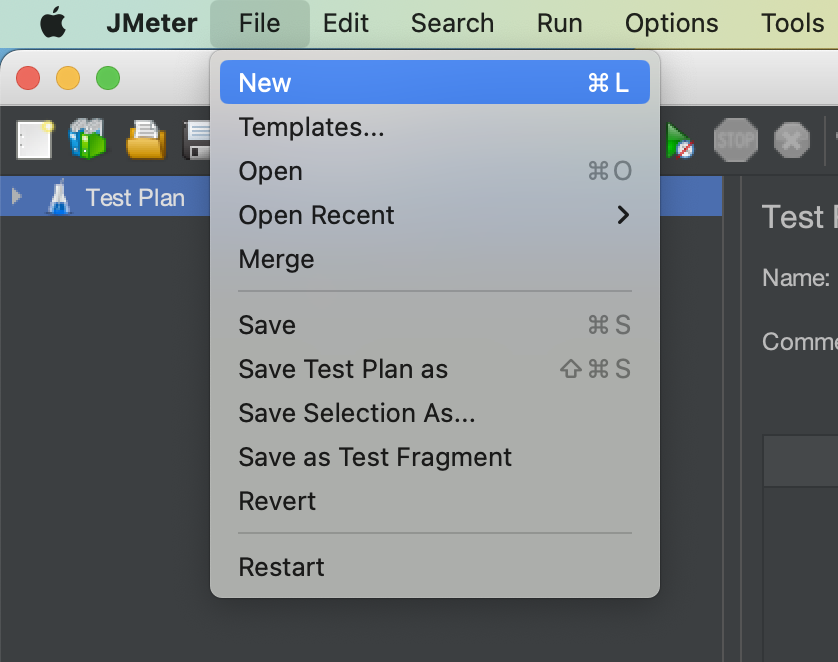
- Launch JMeter.
- Go to the “File” Menu and select “New”.
- This will create a new test plan to be used in our example.
Create a Thread Group
- Right-click on the Test Plan.
- To create a Thread group, simply go to “Add > Threads (Users) > Thread Groups”.
- Let’s set the number of threads to 2 and run the test for 120 seconds (or 2 minutes).

Add Constant Throughput Timer
- Right-click on the Thread group.
- To Add a “Constant Throughput Timer“, simply go to “Add > Timer > Constant Throughput Timer”.

We can see that there are majorly two components of Constant Throughput Timer
- Target throughput ( in samples per minute)
- Calculate throughput based on:
- this thread only
- all active threads
- all active threads in current thread group
- all active threads ( shared )
- all active threads in current thread group ( shared )
How to use Constant Throughput Timer with Examples
Example 1 – selecting “this thread only” settings
Let’s start by selecting the below details
- Target Throughput as “30 requests per minute”.
- Calculate throughput based on – “this thread only”.

And as you remember, we have set the “number of threads” as 2 and “duration” as 120 seconds in thread group.
Let’s also add an HTTP Request Sampler to send an HTTP API call, along with an Aggregate Report listener to visualize the actual throughput of our test plan.
Adding an HTTP sampler
We will use the HTTP sampler to execute a dummy API (https://jsonplaceholder.typicode.com/posts/1).
Create an HTTP sampler by right-clicking on the Thread Group and selecting “Add” > “Sampler” > “HTTP Request”.

We will hit the GET request on the “https://jsonplaceholder.typicode.com/posts/1” API. So, we will add it to the HTTP sampler by following the below steps.
- Please enter “https” in the input box that is labelled “Protocol[https]:“.
- Enter “jsonplaceholder.typicode.com” in the input box labelled “Server Name or IP”.
- By default, the HTTP request value is set to GET. Since we are only executing a GET request, we won’t be changing it.
- Set the Path to “/posts/1“.

Adding Aggregate Report Listener

Run Test and monitor results
Now, click on the Green Run button to start the test.

We can see that the throughput came out to be 1 request/sec or 60 requests/minute, but we have set the throughput to be 30 requests/minute in the constant throughput timer. So, why did the actual throughput end up being twice as much?
This happened because we set the number of threads to 2 and chose the “This thread only” option in the Constant Throughput Timer settings. As a result, each thread tried to maintain a throughput of 30 requests per minute. With 2 threads running, the total throughput effectively became 2 × 30 = 60 requests per minute.
Example 2 – selecting “all active threads” settings
We’ll keep everything the same, except for one change in the Constant Throughput Timer settings – this time, we’ll select “All active threads” from the dropdown

Now, let’s run the test once again and observe the results.

We can see that the throughput is 31 requests per minute, which is close to the target of 30 requests per minute that we set in the Constant Throughput Timer settings.
So, it’s important to be mindful of the option you choose in the Constant Throughput Timer, as it can significantly impact your load test results.
We hope that you have liked the article. If you have any doubts or concerns, please write to us in the comments or mail us at admin@codekru.com.