
When creating or modifying a test plan, we often need to debug our scripts to ensure that we get the desired results. This is particularly true when working with complex scripts that involve many components and variables. Fortunately, JMeter has a Debug sampler that makes it easy to debug scripts. This tool allows us to view the values of all JMeter variables and properties, which can then be seen in the Response Data tab of the “View Results Tree” listener.
We will create a test plan and execute the “https://jsonplaceholder.typicode.com/posts/1” API while analyzing the variables we will create and extract from the responses.
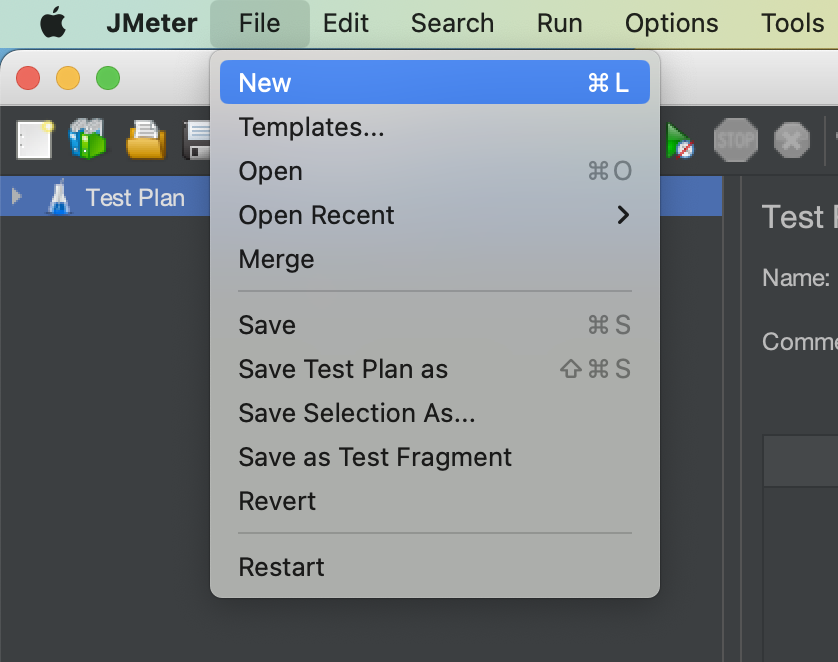
Set Up a Test Plan
- Launch JMeter.
- Go to the “File” Menu and select “New”.
- This will create a new test plan to be used in our example.
Create a variable
We will create a host variable with the “jsonplaceholder.typicode.com” value.
- Click on the “Add” button in the Test Plan screen.
- Enter “host” in the “Name:” section and “jsonplaceholder.typicode.com” in the “Value” section.

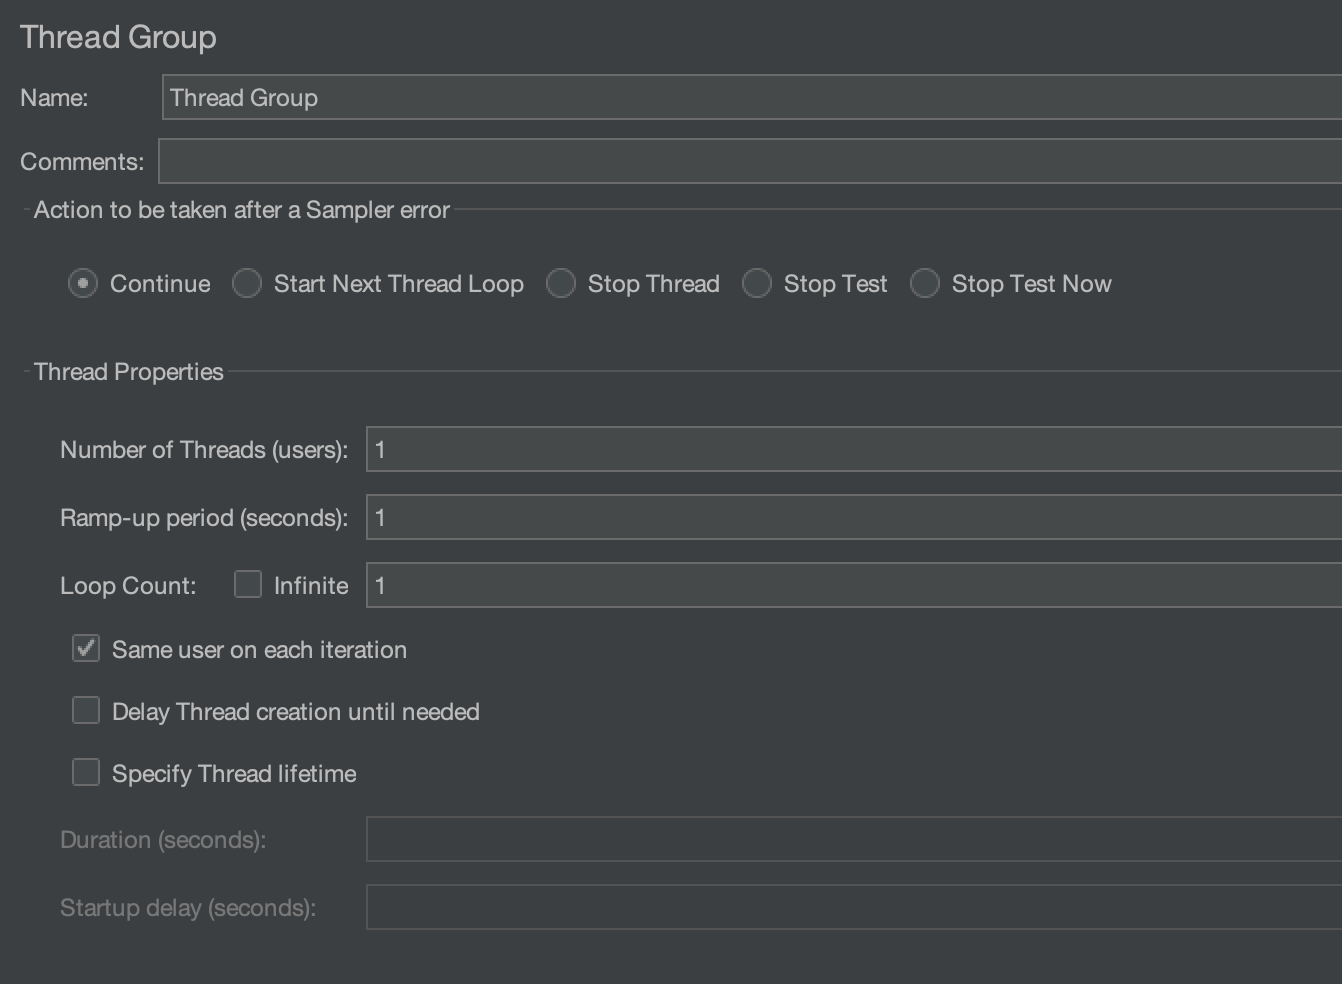
Create a Thread Group
- Right-click on the Test Plan.
- To create a Thread group, simply go to “Add > Threads (Users) > Thread Groups”.

The Thread Group is used to execute a specific number of tests. For simplicity, we will keep it set at 1. Please refer to the image below for configurations.
Add the Debug Sampler
Right-click on the “Thread Group” and select “Add” > “Sampler” > “Debug Sampler”.

By default, it will only print JMeter variables. We can also choose to print JMeter and system properties by selecting “True”.

Add “View Results Tree” listener
Add the “View Results Tree” listener by right-clicking on the “Thread Group” and selecting “Add” > “Listener” > “View Result Tree”.

Execute the test plan and observe the entries in the “View Results Tree”
Click on the “Green” start button to execute the Test Plan.

After executing the test plan, you can view the results in the “View Results Tree”. Look for the “Debug Sampler” request and click on it. Then, go to “Response data” to see all the JMeter variables printed, including the “host” variable.

Execute the HTTP request and debug the extracted value
Add HTTP sampler
Add an HTTP sampler by right-clicking on the Thread Group and selecting “Add” > “Sampler” > “HTTP Request”.

We will hit the GET request on the “https://jsonplaceholder.typicode.com/posts/1” API. So, we will add it to the HTTP sampler by following the below steps.
- Please enter “https” in the input box that is labelled “Protocol[https]:“.
- Enter “${host}” in the input box labelled “Server Name or IP”. The value of the “host” variable, which is set to “jsonplaceholder.typicode.com”, will be resolved at runtime.
- By default, the HTTP request value is set to GET. Since we are only executing a GET request, we won’t be changing it.
- Set the Path to “/posts/1“.

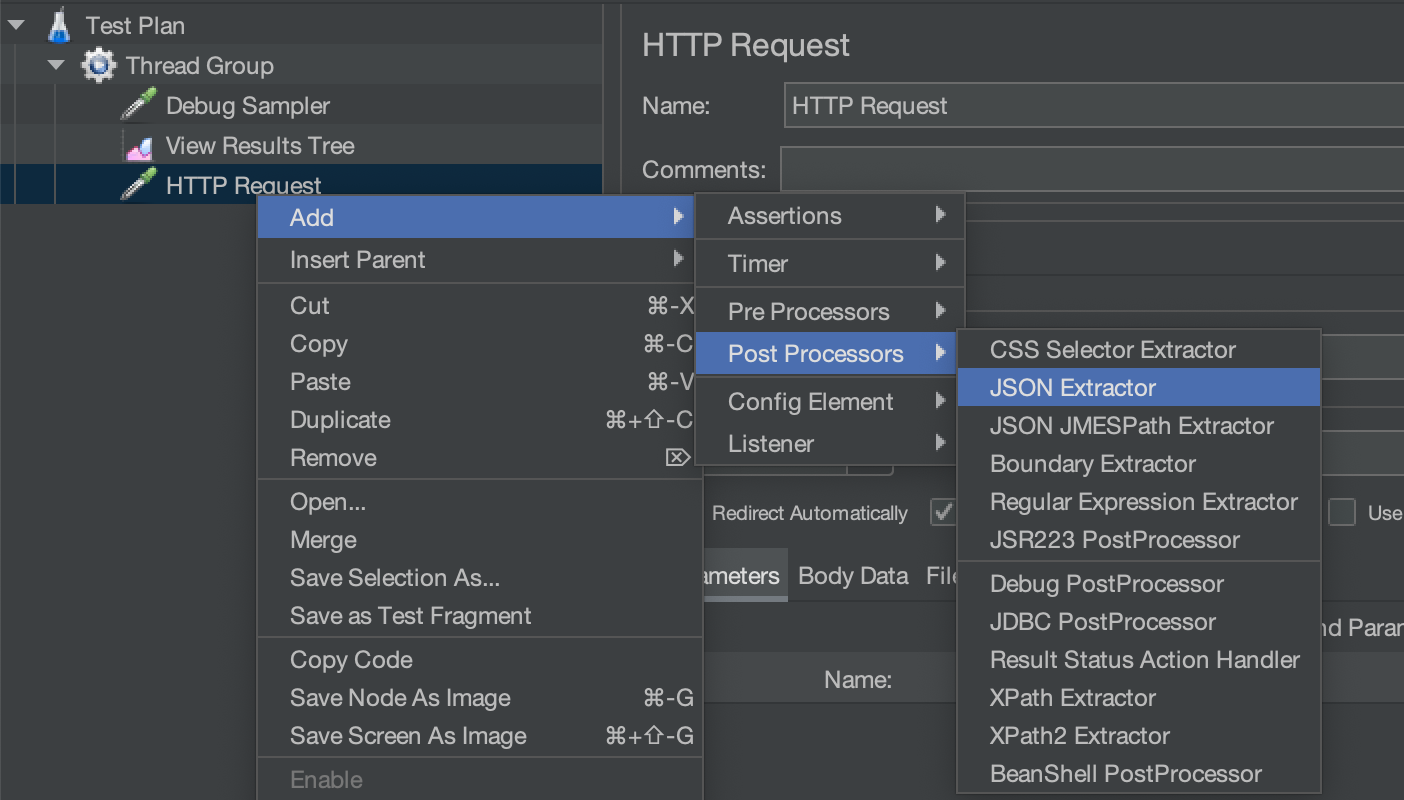
Add JSON Extractor
We will get the below response after executing the “https://jsonplaceholder.typicode.com/posts/1” API.
{
"userId": 1,
"id": 1,
"title": "sunt aut facere repellat provident occaecati excepturi optio reprehenderit",
"body": "quia et suscipit\nsuscipit recusandae consequuntur expedita et cum\nreprehenderit molestiae ut ut quas totam\nnostrum rerum est autem sunt rem eveniet architecto"
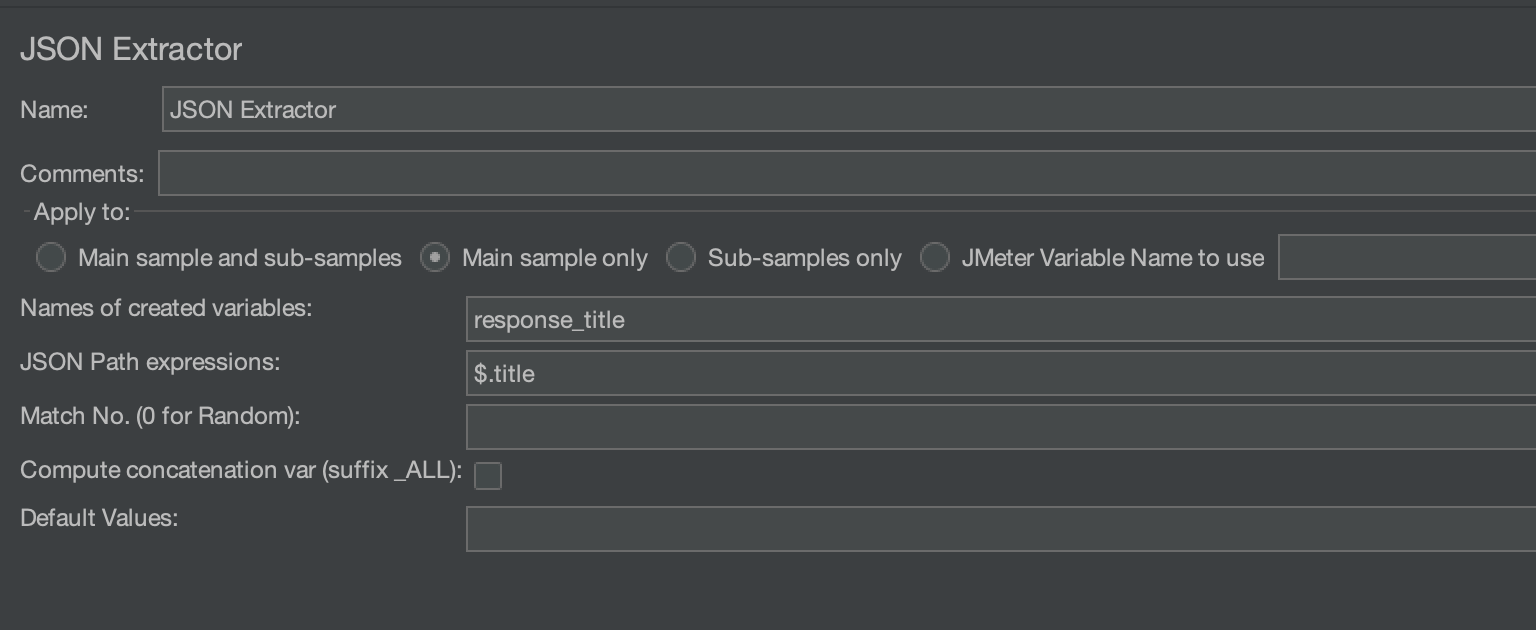
}We will extract the “title” value using JSON extractor and store it in the “response_title” variable. Later, we will verify whether its value has been properly extracted or not using the Debug sampler.
Right-click on the “HTTP Request” and select “Add” > “Post Processors” > “JSON Extractor”.
Use the JSON Path expression “$.title” to extract the “title” from the API response. The extracted data will be saved in the variable specified in the “Names of created variables:” input box, which in our case is “response_title“.
Again second debug sampler
Add a second debug sampler named “Debug sampler 2” to differentiate it from the previous one.

Run the Test Plan
Please execute the test plan once more and view the outcome in the “View Results Tree” section.
You will find two debug samplers in the listener. If you click on the 2nd debug sampler, you will see the value of the response_title variable printed along with the host variable.

This is how we can use debug samplers in JMeter to examine values of variables or properties anytime during the Test Plan.
We hope that you liked the article. If you have any doubts or concerns, please write to us in the comments or mail us at admin@codekru.com.