
Developer tools is a powerful tool to debug and analyze web pages, and many modern browsers provide inbuilt support for it. It allows developers to inspect elements, debug JavaScript, and analyze network activity. This post will discuss how selenium can be used with Chrome DevTools to automate tasks and test web pages.
Why we should automate the Chrome Devtools?
Interacting with Chrome DevTools using Selenium is a powerful way to enhance web testing capabilities and improve test automation coverage.
DevTools is a collection of web developer tools built into the Google Chrome browser, and Selenium is a popular open-source automation tool that enables us to automate web browsers. By combining the two, we can automate various testing tasks such as performance testing, network analysis, and more.
With Selenium, we can automate Chrome DevTools to perform various actions, such as intercepting network requests, simulating different geographical locations, and capturing console logs. This allows us to quickly identify and fix issues in the web application. By using Selenium and Chrome DevTools together, we can improve your web testing workflow and ensure that the website performs optimally for the users.
How to open the Chrome DevTools
We can open the developer tools by right-clicking on the webpage and selecting the “inspect” option.

Clicking on the “Inspect” option will open the developer tools, where you’ll see many tabs like Element, Console, Network, etc.

Here is a list of a few of the tabs –
There are other tabs as well, but normally above tabs are used more often than the others. Let’s briefly describe them, and then we will learn to use selenium with chrome devtools.
Elements
The Elements tab shows the HTML and CSS used to build the webpage and the inline javascript code. We can change the HTML code or any CSS to check how the page will look.
Console
The console tab provides a way to view and interact with the JavaScript code on your pages.
Source
The Source tab shows all the files used to make up the webpage. It employs a debugger feature which can be used to debug the Javascript code.
Network
The Network tab allows you to view and analyze the network activity of a web page. It provides information about the page’s resources, including file size, load time and request headers.
Application
It provides insight into the data stored by a webpage on your browser, like cookies stored in local storage and indexed DB data.
Security
The Security tab provides information about the basic security of a webpage. We can look at the site’s certificate or the connection it provides ( secure or not ).
Performance
This tab can be used to analyze the performance of a webpage and identify bottlenecks that may be affecting its speed.
Now, let’s see how we can automate the chrome devtools with Selenium.
How to automate with chrome Devtools using Selenium?
Selenium 4 introduced DevTools API to interact with the chrome developer tools.
Note: We are using selenium 4.8.0 with chrome version 109.
First, we will create a session with DevTools
		ChromeDriver driver = new ChromeDriver();

		DevTools devTools = driver.getDevTools();
		devTools.createSession();
Now, let’s interact with the devtools to pull up some information. We will look at some of the commonly used ones.
- Collect Performance metrics
- Capture console logs
- Simulate location
- Network throttling
- Capture Network calls requests and responses
Let’s look at them one by one.
Collect Performance metrics
We can enable the collecting and reporting metrics using Performance.enable(Optional.empty()) and then get the metrics information using the Performance.getMetrics().
Performance.getMetrics() returns a list of Metric objects, which we can then iterate to get information about each performance metric.
Let’s try to get the performance metric of the make my trip website.
import java.util.List;
import java.util.Optional;

import org.openqa.selenium.WebDriver;
import org.openqa.selenium.chrome.ChromeDriver;
import org.openqa.selenium.devtools.DevTools;
import org.openqa.selenium.devtools.v109.performance.Performance;
import org.openqa.selenium.devtools.v109.performance.model.Metric;

public class CodekruTest {

	public static void main(String[] args) {

		// pass the path of the chromedriver location in the second argument
		System.setProperty("webdriver.chrome.driver", "E:\\chromedriver.exe");
		ChromeDriver driver = new ChromeDriver();

		DevTools devTools = driver.getDevTools();
		devTools.createSession();

		devTools.send(Performance.enable(Optional.empty()));
		List<Metric> metricList = devTools.send(Performance.getMetrics());

		driver.get("https://www.makemytrip.com");

		for (Metric m : metricList) {
			System.out.println(m.getName() + " = " + m.getValue());
		}

	}

}
Output –
Timestamp = 1608.660693
AudioHandlers = 0
Documents = 2
Frames = 1
JSEventListeners = 0
LayoutObjects = 6
MediaKeySessions = 0
MediaKeys = 0
Nodes = 8
Resources = 0
ContextLifecycleStateObservers = 2
V8PerContextDatas = 1
WorkerGlobalScopes = 0
UACSSResources = 0
RTCPeerConnections = 0
ResourceFetchers = 2
AdSubframes = 0
DetachedScriptStates = 0
ArrayBufferContents = 0
LayoutCount = 0
RecalcStyleCount = 0
LayoutDuration = 0
RecalcStyleDuration = 0
DevToolsCommandDuration = 1.7E-5
ScriptDuration = 0
V8CompileDuration = 0
TaskDuration = 2.4E-5
TaskOtherDuration = 7.0E-6
ThreadTime = 6.8E-5
ProcessTime = 0.03125
JSHeapUsedSize = 877696
JSHeapTotalSize = 1896448
FirstMeaningfulPaint = 0
DomContentLoaded = 1608.340013
NavigationStart = 1608.062498
Your output result may vary from our results. This was to show how we can get the performance metrics of any webpage using selenium.
Capture console logs using Selenium DevTols
The console tab of the developer tools often displays some useful information that can be used for debugging or analyzing web page issues. We will now get that information using selenium.
Log.Enable() command enables the log and sends the entries collected so far to the client by means of the entryAdded notification. We can add a listener to listen to the entryAdded notifications and fetch the required information per our requirements.
   devTools.send(Log.enable());
   devTools.addListener(Log.entryAdded(),  logEntry -> {
		            System.out.println("log: "+logEntry.getText());
		            System.out.println("level: "+logEntry.getLevel());
		             System.out.println("source: "+logEntry.getSource());
		        });
- getText() method gets the text shown for the particular log.
- getLevel() method returns the level of the log. Allowed values are verbose, info, warning, error.
- getSource() gets the source of the error. It can be one of the following –
- xml, javascript, network, storage, appcache, rendering, security, deprecation, worker, violation, intervention, recommendation, other
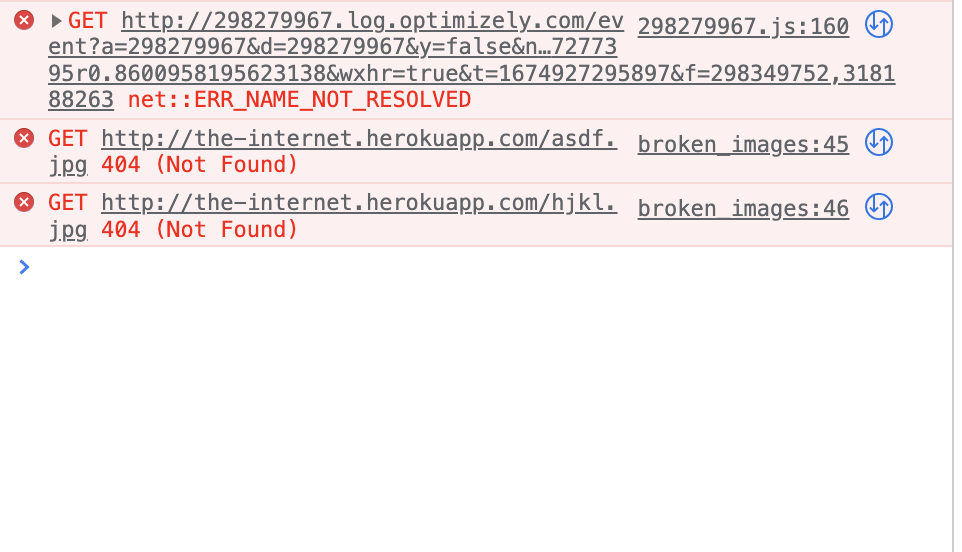
We will use the “http://the-internet.herokuapp.com/broken_images” URL, which throws some errors, as shown in the image below.
Now, we will get the console logs using selenium DevTools API.
import org.openqa.selenium.chrome.ChromeDriver;
import org.openqa.selenium.devtools.DevTools;
import org.openqa.selenium.devtools.v109.log.Log;

public class CodekruTest {

	public static void main(String[] args) {

		// pass the path of the chromedriver location in the second argument
		System.setProperty("webdriver.chrome.driver", "E:\\chromedriver.exe");

		ChromeDriver driver = new ChromeDriver();

		DevTools devTools = driver.getDevTools();
		devTools.createSession();

		devTools.send(Log.enable());
		devTools.addListener(Log.entryAdded(),
		                           logEntry -> {
		                               System.out.println("log: "+logEntry.getText());
		                               System.out.println("level: "+logEntry.getLevel());
		                               System.out.println("source: "+logEntry.getSource());
		                           });
		driver.get("http://the-internet.herokuapp.com/broken_images");


	}

}
Output –
log: Failed to load resource: the server responded with a status of 404 (Not Found)
level: error
source: network
log: Failed to load resource: the server responded with a status of 404 (Not Found)
level: error
source: network
log: Failed to load resource: net::ERR_NAME_NOT_RESOLVED
level: error
source: network
Note: We can also fetch the console logs without using the dev tools for which we have written a different article. Please read that article to learn more about getting the console logs in selenium without using DevTools API ( Article link – How to capture the console logs in Selenium Java? ).
Simulating location
As testers, sometimes we have to test our UI application on multiple geographies. DevTools API in selenium helps us set a location to run our test case scenario.
Emulation.setGeolocationOverride() helps stimulate geolocation, and it accepts three parameters – latitude, longitude and accuracy.
        // mumbai location
		double latitude = 19.0760;
		double longitude = 72.8777;

		devTools.send(Emulation.setGeolocationOverride(Optional.of(latitude), Optional.of(longitude), Optional.of(1)));
Here is the whole program –
import java.util.Optional;

import org.openqa.selenium.chrome.ChromeDriver;
import org.openqa.selenium.devtools.DevTools;
import org.openqa.selenium.devtools.v109.emulation.Emulation;

public class CodekruTest {

	public static void main(String[] args) {

		// pass the path of the chromedriver location in the second argument
		System.setProperty("webdriver.chrome.driver", "E:\\chromedriver.exe");
		ChromeDriver driver = new ChromeDriver();

		DevTools devTools = driver.getDevTools();
		devTools.createSession();

		// mumbai location
		double latitude = 19.0760;
		double longitude = 72.8777;

		devTools.send(Emulation.setGeolocationOverride(Optional.of(latitude), Optional.of(longitude), Optional.of(1)));
		driver.get("https://my-location.org/");

	}

}
Network throttling
Network throttling is a technique used to simulate slower internet connection speeds to test the performance of a website or web application.
We will first enable the Network tracking using Network.enable() and then simulate the network conditions using Network.emulateNetworkConditions().
emulateNetworkConditions() method accepts five parameters –
- offline
- latency ( in ms )
- downloadThroughput ( in bytes/sec )
- uploadThroughput ( in bytes/sec )
- connectionType ( CELLULAR2G, CELLULAR3G, CELLULAR4G, etc. )
devTools.send(Network.enable(Optional.of(1000000), Optional.empty(), Optional.empty()));
devTools.send(Network.emulateNetworkConditions(false, 1000, 1000000, 1000000, Optional.of(ConnectionType.CELLULAR3G)));
import java.io.IOException;
import java.util.Optional;

import org.openqa.selenium.WebDriver;
import org.openqa.selenium.chrome.ChromeDriver;
import org.openqa.selenium.devtools.DevTools;
import org.openqa.selenium.devtools.v85.network.Network;
import org.openqa.selenium.devtools.v85.network.model.ConnectionType;

public class CodekruTest {

    public static void main(String[] args) throws IOException {

        // pass the path of the chromedriver location in the second argument
        System.setProperty("webdriver.chrome.driver", "E:\\chromedriver.exe");
        WebDriver driver = new ChromeDriver();

        DevTools devTools = ((ChromeDriver) driver).getDevTools();
        devTools.createSession();
        devTools.send(Network.enable(Optional.of(1000000), Optional.empty(), Optional.empty()));
        devTools.send(
                Network.emulateNetworkConditions(false, 100, 1000000, 1000000, Optional.of(ConnectionType.CELLULAR3G)));

        driver.get("https://www.youtube.com");
    }

}
We have also written an article explaining Network throttling in more detail. ( Article Link – Network throttling in Chrome with Selenium )
Capture Network calls requests and responses
Various calls are made to fetch information or resources when a user interacts with a website. All these are captured and can be viewed in the network tab. Now, we will also capture the requests and responses of the network calls by the use of selenium DevTools API.
Get network call requests
We will again enable the network tracking using Network.enable() method, and then we can listen to the event that is fired on every HTTP request, as shown below
devTools.addListener(Network.requestWillBeSent(), request -> {

});
request.getRequest().getMethod()returns the request method of the request like GET, POST, etc.request.getRequest().getUrl()returns the request URL.request.getRequest().getHeaders()gets the headers of an HTTP request.- and
request.getRequest().getPostData()returns the request body of the HTTP request.
import java.util.Optional;

import org.openqa.selenium.WebDriver;
import org.openqa.selenium.chrome.ChromeDriver;
import org.openqa.selenium.devtools.DevTools;
import org.openqa.selenium.devtools.v109.network.Network;

public class CodekruTest {

    public static void main(String[] args) {

        // pass the path of the chromedriver location in the second argument
        System.setProperty("webdriver.chrome.driver", "E:\\chromedriver.exe");
        WebDriver driver = new ChromeDriver();

        DevTools devTools = ((ChromeDriver) driver).getDevTools();
        devTools.createSession();
        devTools.send(Network.enable(Optional.of(1000000), Optional.empty(), Optional.empty()));
        devTools.addListener(Network.requestWillBeSent(), request -> {
            System.out.println("Request Method : " + request.getRequest().getMethod());
            System.out.println("Request URL : " + request.getRequest().getUrl());
            System.out.println("Request headers: " + request.getRequest().getHeaders().toString());
            System.out.println("Request body: " + request.getRequest().getPostData().toString());
        });

        driver.get("https://www.makemytrip.com");

    }

}
Get network call responses
Similarly, we can get the network call responses and all the information regarding an HTTP response, like response headers, response body, response code, etc.
For listening to responses, we would be using Network.responseReceived() in place of the Network.requestWillBeSent().
import java.util.Optional;

import org.openqa.selenium.WebDriver;
import org.openqa.selenium.chrome.ChromeDriver;
import org.openqa.selenium.devtools.DevTools;
import org.openqa.selenium.devtools.v109.network.Network;

public class CodekruTest {

    public static void main(String[] args) {

        // pass the path of the chromedriver location in the second argument
        System.setProperty("webdriver.chrome.driver", "E:\\chromedriver.exe");
        WebDriver driver = new ChromeDriver();

        DevTools devTools = ((ChromeDriver) driver).getDevTools();
        devTools.createSession();
        devTools.send(Network.enable(Optional.of(1000000), Optional.empty(), Optional.empty()));
        devTools.addListener(Network.responseReceived(), responseReceived -> {
            String responseUrl = responseReceived.getResponse().getUrl();
            RequestId requestId = responseReceived.getRequestId();
            if (responseUrl.contains("makemytrip")) {
                System.out.println("Url: " + responseUrl);
                System.out.println("Response headers: " + responseReceived.getResponse().getHeaders().toString());
                System.out.println("Response body: " + devTools.send(Network.getResponseBody(requestId)).getBody());
            }

        });

        driver.get("https://www.makemytrip.com");

    }

}
This is it. We can perform many other operations using the Selenium DevTools API and interact with the Chrome developer tools. If you want us to write over any specific interactions, please write us in the comments or email us at admin@codekru.com.